Broadband: for love or money?

Malcolm Turnbull recently made an interesting claim about the relationship between internet access and wealth: that lower-income households are hugely under-represented amongst internet users and will, thanks to NBN Co's commitment to uniform nationwide pricing, be subsidising the fast internet of their wealthier (and more numerous) counterparts when the NBN comes to town.
"For all of Senator Conroy's rhetoric about eliminating the tyranny of distance, the biggest barrier to Australians taking up broadband is its cost," Turnbull wrote, citing Australian Bureau of Statistics (ABS) figures suggesting that just 43 per cent of homes with household incomes below $40,000 have internet access. On the other hand, he said, among those with family incomes of over $120,000, internet access was all but ubiquitous, with 94 per cent penetration. Connecting the dots, he has decided the internet is still leaving ordinary battlers behind — and that the problem is worse in the bush, where just 62 per cent of households are connected compared with 75 per cent in the cities.
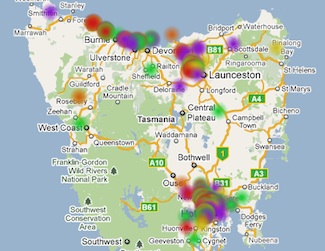
Tasmania has many wide open spaces with no broadband whatsoever — but is this because it's too expensive, or simply unavailable?
(Screenshot by David Braue/ZDNet Australia)
Turnbull's conclusion — repeated in his response to Labor's Digital Economy Strategy launch, is that price is an issue. Yet there are ready rebuttals to this: for example, that the online class divide is nowhere near as large as he suggests. Indeed, 75 per cent of the $40,000 to $79,999 crowd and 89 per cent of the $80,000 to $119,999 crowd have internet access. This suggests internet access is pretty common amongst Australians, since the ABS tells us that the average Australian's weekly wages are $1010.30 per week ($52,535.60 pa).
The internet, it seems, is not the exclusive province of the well-heeled after all. Yet these figures do raise questions: for example, if internet access is such a basic service these days, why is one out of four of $40,000 to $79,999 earners still not online? If cost is such an important factor in getting broadband, surely people on this sort of income would be able to afford even a basic broadband service? Perhaps then the problem is more that they just can't access them?
We know, after all, that many, many Australians are still getting online using dial-up. We know Telstra has crippled what I'm told will be over 1 million new housing developments with cost-saving (and ADSL2+-nobbling) RIMs, and that many broadband customers are being given broadband-incapable wireless voice phones as interim measures.
Given the commercial imperative of telcos (they are businesses after all) perhaps they have simply ignored lower-income areas of Australia because they have not been able to make a commercial case to provide broadband there — well, put simply, they do not really want Australia's poorest citizens as customers.
Tasmania — our poorest state in sheer economic terms, with average income (XLS) of $843.16 per week compared with $996.37 in NSW, $1072.65 in WA and $1239.33 in the ACT — is also the state with the lowest broadband penetration.
Telstra certainly hasn't rushed into the Apple isle; many areas of Tasmania are only getting their first opportunity to get DSL of any kind now that the telco has decided it can be bothered upgrading their exchanges — more than five years after our huggable, lovable "ex"-monopolist brought ADSL2+ to the (more heavily populated, wealthier and more potentially profitable) country's CBDs. Even Optus has taken its time, only announcing now that it will pitch a few million to improve its presence across Tasmania.
I asked ex-Tasmanian Premier David Bartlett about this issue after his CeBIT presentation yesterday, and he was of the mindset that availability, and not price or ability to pay, was the major factor obstructing Tasmania's broadband take-up. And availability, he added, had been hampered by lack of convincing infrastructure. "Tasmania did have some of the lowest take-up rates in the country but largely, I think, because what we were getting for the price was rubbish," he said. "People pay for what they'll get, and [they were saying] if I've got $60 of disposable income per month should I spend it on Austar or ADSL? The merging of those in our homes on the NBN will mean it's the answer."
So, we have Turnbull saying the issue is price, and Tasmania's ex-premier saying it's all about availability. But are lower-income areas getting worse broadband, or no broadband at all? To test this theory, I spent some time perusing the ADSL2+ coverage "heat maps" maintained by the excellent folks at www.adsl2exchanges.com.au. These maps use coloured data points to represent real-world broadband speeds, with colours ranging from purple (1.5Mbps or lower, corresponding to slow ADSL, ISDN or dial-up) to orange (10 to 15Mbps) and red (15Mbps+), both of which suggest the presence of ADSL2+. Look at any metropolitan area across our country, and you'll see that these real-world maps of broadband performance show a large number of white areas where broadband speed is pitiful or simply non-existent.
My question was, simply: are these blackspots more common in relatively low-income areas? If Turnbull's contention is correct, we should see a correlation between internet speeds and personal income, with poorer areas showing less broadband because they can't, as he suggests, afford it.
Tasmania's heatmap has relatively few data points that likely reflect a collection bias, but their overall gist is clear: broadband speeds drop off quickly outside of Hobart, with most non-metro areas reporting speeds of less than 1.5Mbps and the majority of the state reporting no data at all.
Mapping the ADSL2Exchanges data against 2006 Census income figures (available via the ABS's MapStats service) adds an income element to our explorations. In the below graph, income data is represented by shades of colour, with lighter colours representing a low proportion of residents on $500 or less per week and progressively deeper reds showing a higher level of poverty.
(Credit: ABS)
Reported broadband speeds across Hobart vary widely, but the densest array of red spots was, as you would expect, in the CBD; outlying areas quickly dropped down to purple, confirming that residents in these areas have yet to benefit from ADSL2+. Comparing local income figures with broadband quality, however, didn't suggest any obvious bias against lower-income households; plenty of wealthier suburbs were getting bad broadband too.
The ACT, by contrast, has a broader spread of broadband across its suburbs. While the majority of speeds seemed to fall in the purple or green (1.5Mbps to 5Mbps, suggestive of ADSL1 services) range, if you zoom in, there are plenty of red and orange spots clustered in different parts of the territory.
(Credit: ABS)
(Credit: ABS)
Indeed, looking at these maps, the correlation between broadband quality and overall income levels doesn't seem to be a tight one. While wealthier areas like Parramatta Park are stained red with high-seed broadband, poorer areas of North Parramatta and Wentworthville have their own 15Mbps+ areas. And in the ACT, lower-income areas of McKellar report fast broadband speeds while wealthier areas like Florey and Charnwood clock in pretty-poor broadband speeds.
Now, I fully appreciate that this is only a random sample that may not be either representative nor predictive. ADSL2Exchange's data is hardly comprehensive — but it's the best we've got. And, with a clustering of service levels across particular geographic communities, I'd suggest it is not entirely useless. This sort of analysis could be done for any region around Australia, and might well show different results based on the particular area you're looking at. And if it were, I suspect you'd see many of the same old stories, repeated over and over again.
Whether or not they're comprehensive, I hope these graphics will spur some thinking on the real reasons for continuing broadband deficiencies. Turnbull is quick to use broadband pricing as a cudgel over Stephen Conroy's head, but it seems there may be other reasons entirely why entire areas of Australia are still struggling to get decent broadband — or not even bothering to try.
What do you think? Is Turnbull right? Is our suburban broadband deficit due to its being too expensive? Or is the problem simply that Telstra's commercial imperatives mean it's still unavailable in far more places than you would think?